Location Matters

The vast majority of electricity worldwide is generated and consumed within the same country. Yet, current carbon accounting standards allow companies to claim consumption of power that, in reality, could never be transmitted across borders. This blog looks at the data to inform the debate.
Key findings include:
- The vast majority (80+% in most cases) of electricity is produced and consumed in the same country, this is true even in relatively well-interconnected regions like Europe.
- Carbon accounting rules, such as the GHG Protocol Scope 2 guidance, should take note of this, and should only allow EAC flows across borders that align with real power flows. This creates incentives to increase deliverability through interconnection should buyers want to claim attributes across borders.
As the global energy transition accelerates, understanding the dynamics of cross-border electricity flows becomes increasingly important. Increased interconnection to help ensure deliverability across and within national borders is important to enable the efficient use of clean energy. A recent article by The Economist highlights that less than 3% of the world’s power is traded internationally, underscoring the opportunities that remain for greater interconnection. This blog delves into these numbers at a regional level.
This blog explores cross-border electricity flows and electricity self-sufficiency metrics for various countries using the latest data from the International Energy Agency (IEA). Except for the US, we do not look at flows across regions within countries, where there is also often significant congestion (e.g. in China or India). Such constraints are important and should be taken into account when considering deliverability boundaries in electricity grids.
Based on this analysis, we focus on implications for carbon accounting, where today companies can claim the use of contractual instruments like EACs across broad geographical boundaries1, often in volumes that significantly exceed the real electricity flows across borders2. Addressing these deliverability concerns3 is important to accurate and robust carbon accounting.
So, how much electricity flows across borders?
To answer this question, we use IEA data on imports and exports for key countries and calculate a self-sufficiency metric (Generation/Total Demand) which measures the extent to which a country meets its electricity demand through domestic generation. A high self-sufficiency ratio indicates that a country generates most or all of its electricity domestically, potentially even producing a surplus for export. Conversely, a low self-sufficiency ratio signals a greater reliance on imports to meet domestic electricity demand. The following graphs are ranked from highest to lowest electricity generation.
Europe
Figure 1 – Cross-border Flows in Selected European Countries.
This graph shows both the magnitude of imports and exports in various European countries. Some countries like France and Sweden export a significant amount of power. Others like Germany and Belgium have roughly equal imports vs exports. Finally, some countries like Italy and the UK are net importers of power. This gives us an interesting overview, but to understand the relationship between cross-border flows and consumption of in-country generation we need relative figures.
Figure 2 – Self-sufficiency Index of Select European Countries.
The graph above shows us that most countries in Europe are highly self-sufficient in electricity with all of the Top 10 electricity consumers producing over 80% of the electricity they consume. Some countries exceed 100%, indicating they generate a surplus and export electricity.
Europe – Guarantee of Origin vs Power Flows
So, we have seen that in Europe, electricity is far more likely to be consumed in the country where it is produced. However, the Guarantee or Origin, the EU’s regulated system for tracking green electricity, does not require the cross-border flow of GOs to take physical interconnection into account. While the European GO system prevents double-counting, its lack of geographic restrictions raises concerns about the accuracy of green claims and carbon accounting. This concern has been raised by the EU’s power system operators – ENTSO-E. So, let’s look at the data to quantify the extent of the mismatch between GO and real power flows.
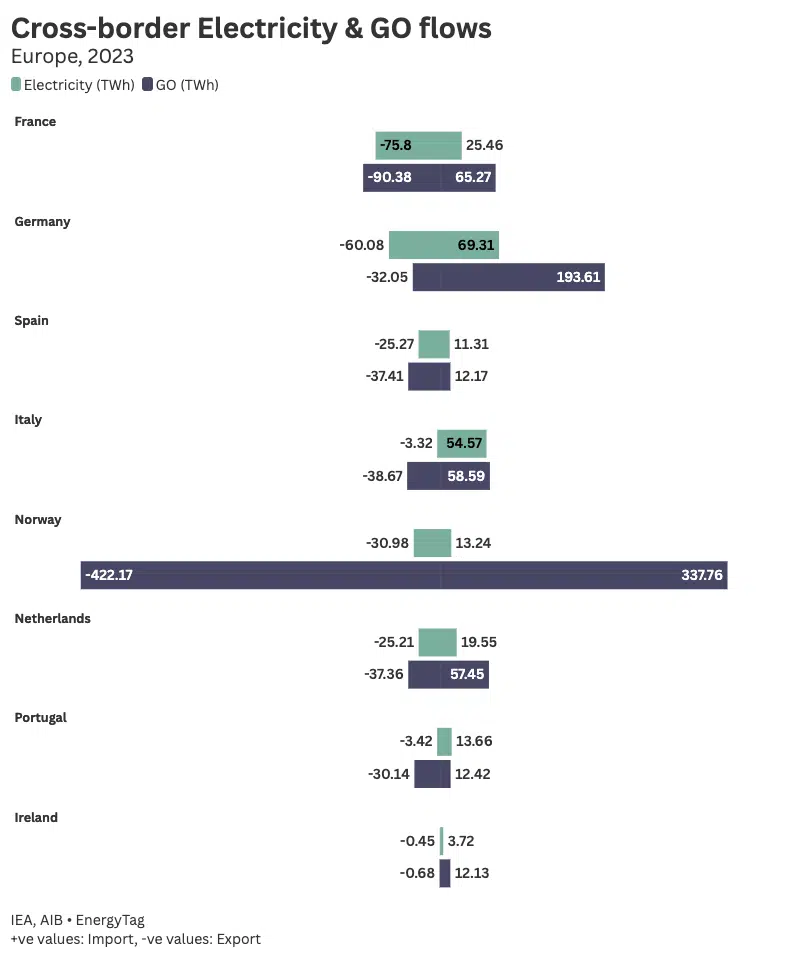
Figure 3 – Cross-border Electricity and GO Flows in Europe.
The graphic above illustrates this significant disconnect between cross-border flows of electricity and GOs. Norway, for instance, exports almost 14 times as many GOs as physical electricity4. Germany imports almost 3 times more GOs than physical power. This can lead to confusion with fuel-mix disclosure by suppliers to consumers in countries that import GOs in significant excess of physical power imports.
For example, in Ireland, for 2023, the fuel mix disclosed to consumers is 61% renewable, while only 41% of domestic generation was from renewable electricity, with electricity imports nowhere close to being sufficient to bridge this gap. Though legally, double-counting is prevented via the residual mix calculation, better alignment of physical and GO flows would help reduce discrepancies between green electricity accounting and grid realities, leading to more efficient market signals for green energy.
North America
Figure 4 – Cross-border Flows in North America.
North America has some cross-border electricity trade, primarily between Canada and the United States in 2023, with small flows across the US-Mexico border.
Figure 5 – Self-sufficiency Index of North America.
This low cross-border flow in North America is reflected in high self-sufficiency values, above 98% for each country. The implication for carbon accounting is clear: aligning EAC flows with physical power flows suggests that only a limited amount of EACs should be eligible to flow across borders in North America.
Figure 6 – US Inter-regional Electricity Flows.
Within the United States, there are also transmission constraints within grid subregions that should be considered. The graph above provides deeper insight into cross-border power exchanges in a select number of grid regions in the US.
Figure 7 – Self-sufficiency Index of Select U.S Regions.
The Self-Sufficiency Index highlights how different U.S. electricity regions largely rely on within-region generation to meet demand, with ERCOT (Texas), PJM, and SPP maintaining near-complete self-sufficiency. The trends observed highlight the need for better alignment between electricity tracking systems and real-world power flows, as today RECs can be used without deliverability restrictions across the United States under the most common carbon accounting frameworks.
Some regulatory frameworks are starting to address these deliverability concerns. For example, the 45V Clean Hydrogen Tax Credit Guidance divides the US into 14 deliverability zones for clean power procurement based on subregional transmission congestion. While not perfect, these regions do a much better job at capturing congestion than assuming the US is fully interconnected.
Asia-Pacific
Figure 8 – Cross Border Flows in Selected Asia-Pacific Countries.
Like North America, overall, there is very little trade of electricity between countries in the Asia-Pacific. Besides relatively significant electricity flows from Laos to Thailand, most countries are highly dependent on generation within their own country.
Figure 9 – Self-sufficiency Index of Select Asia-Pacific Countries.
Most major APAC countries have self-sufficiency rates close to 100%. Thailand is the only relatively significant electricity consumer with a significant amount of imports but still has self-sufficiency above 80%. There is an important need to increase interconnection in APAC to increase clean power integration and related benefits, but today, APAC is far from achieving significant cross-border electricity trading. This is largely due to regulatory and policy differences between countries, which create barriers to a unified electricity market and seamless electricity trading, as each nation operates under distinct energy policies, grid codes, and pricing structures. Political and geopolitical concerns also play a role, as national energy security priorities often discourage long-term electricity trade agreements. Additionally, many APAC electricity markets are still maturing, and the high investment required for cross-border transmission infrastructure remains a major challenge.
However, initiatives like the Lao PDR–Thailand–Malaysia–Singapore Power Integration Project (LTMS-PIP) and other regional grid projects could improve interconnection and support greater electricity exchange. For carbon accounting purposes, keeping deliverability boundaries at a country level is the most accurate way to ensure a reasonable level of deliverability. Indeed, for large countries with distinct grid regions (e.g., China or India) it likely makes sense to have regional deliverability regions within those countries, a lack of publicly available data restricted us from being able to analyze this at this time.
Central and South America
Figure 10 – Cross-border Flows in Select Central & South American Countries.
The electricity exchange between Brazil, Argentina, and Paraguay is the only relatively significant cross-border electricity flow in the region.
Figure 11 – Self-sufficiency Index of Select Central & South American Countries.
However, as shown above, most countries in the region maintain self-sufficiency rates close to 100%. For carbon accounting purposes, these again reflect the need to largely assume that green attributes cannot flow across borders in significant volumes.
Africa
Figure 12 – Cross-border Flows in Select African Countries.
Africa’s cross-border electricity flows remain relatively limited, with a few notable exceptions. Mozambique stands out as a relatively significant exporter of electricity, largely due to its significant hydropower capacity. South Africa has roughly equal imports and exports and acts as a hub of electricity flow within the region.
Figure 13 – Self-sufficiency Index of Select African Countries.
However, besides this, most African nations rely heavily on domestic power generation, reflected in their high self-sufficiency rates. There are exceptions with small countries like Namibia and Niger exhibiting negative self-sufficiency and relying heavily on electricity imports to meet their demand. For carbon accounting purposes, maintaining deliverability boundaries at the country level is essential to ensure credibility, with cross-border flows only allowed when correlated to real power flows. Moving forward, increasing interconnection across African countries, particularly those with abundant hydropower resources, could significantly enhance clean energy integration and support regional energy needs.
Conclusion
The analysis underscores a fundamental reality – globally – the vast majority of electricity is produced and consumed within the same country (and in some cases a sub-national grid region like in the US), even in regions with relatively high interconnection, such as Europe. Carbon accounting rules should acknowledge this and should limit cross-border flows of contractual instruments to align with physical power flows. This will encourage the development of new cross-border transmission infrastructure to increase deliverability across geographies, which is essential to advancing the global electricity system decarbonization.
- For example, it is typical under standards like GHG Protocol and RE100 to consider all of Europe and the US one deliverable zone. ↩︎
- Data on the flows of Energy Attribute Certificates (EACs) outside of Europe remains very limited. While other regions have EAC markets, a lack of data makes it challenging to quantify the extent to which EAC flows exceed physical power flows across border. ↩︎
- Likelihood of electricity being delivered from generation to load. Read more on Deliverability here: https://singularity.energy/boundaries-report ↩︎
- However, it is important to note that Norway acts as a trading hub for GO’s, which is why that number is high. ↩︎