It’s About Time (Part 2): Carbon Intensity

- This blog follows up on “It’s About Time”, which looked at hourly clean electricity availability across global grids. In this second part, we dive deeper into the question: how carbon-intensive is electricity by the hour, not just by the year?
- Using open-source ElectricityMaps data covering ~90% of global electricity generation across 300 zones in 2024, the analysis shows carbon intensity fluctuates widely hour by hour across regions, from 0 to 1158 gCO₂/kWh, revealing stark contrasts across global grids not captured with annual average values.
- As renewables become more prevalent in the power systems, the gap between minimum and maximum carbon intensity becomes more pronounced. This makes hourly data even more important in the coming years as renewables increasingly dominate new global electricity capacity additions.
- As grids decarbonise, flexibility becomes critical. The importance of shifting clean power from times of abundance to times of shortage using storage, and consuming power when renewables are most available is crucial.
- To make carbon accounting credible under Scope 2, both market-based and location-based methods should adopt hourly data to ensure that emissions reporting reflects the true emissions of electricity consumption, particularly now that the data is freely available in the public domain.
Stories of Grid Decarbonization
This follow-up blog explores four stories showing how hourly carbon intensity varies across global grids by differing levels of decarbonisation maturity. For detailed statistics on the hourly carbon intensity distribution in these regions, see Annex 1.
Story 1 – Still Fossil Fueled, Round-the-Clock: India
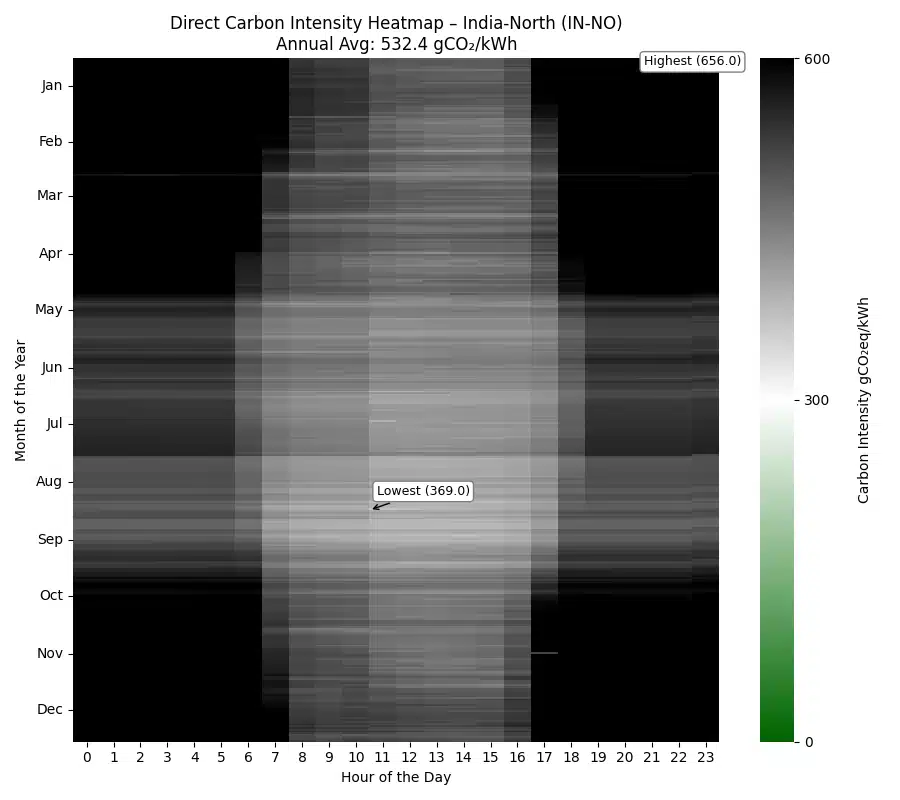
- Regional Characteristics (India): India’s Northern grid is heavily fossil-based, with a carbon intensity range of 369-656 gCO₂/kWh and some mild variation across the day, making the maximum 1.8 times higher than the minimum. There are cleaner periods during solar output, particularly during summer days, but no hours come close to truly clean electricity supply, with coal the dominant source of electricity at night throughout the year.
- Decarbonization Priorities: There is still much work to be done including the continued development of solar and wind, combined with clean flexibility technologies like storage, to deliver clean power when renewables are not available.
Story 2 – Starting the Clean Up, Around the Clock: China & United States
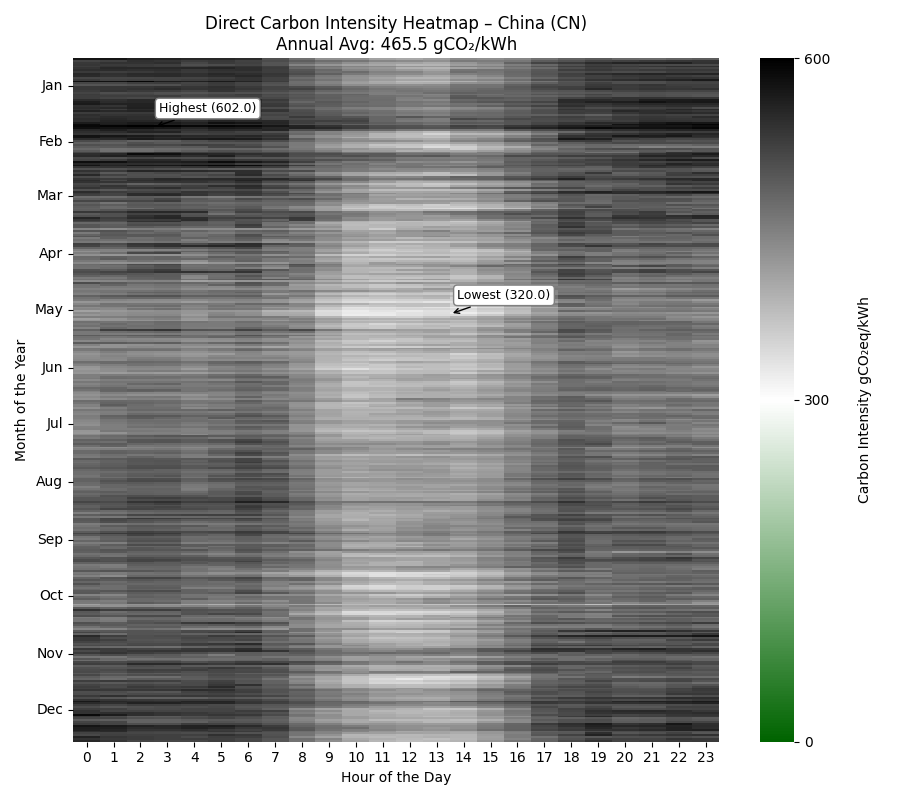
- Region Characteristics (China): China displays moderate variability, with the highest hourly carbon intensity about 1.9 times higher than the lowest (602 → 320 gCO₂/kWh). Fossil generation dominates the system, but solar is starting to impact midday carbon intensity, especially in spring and summer. We see the presence of hydro and wind also, eating into night-time coal generation.
- Decarbonization Priorities: Prioritize scaling solar, wind, and hydro further, add energy storage to cover post-sunset hours, and encourage demand flexibility through time-aligned procurement. Transparency and incentives for granular emissions tracking could improve procurement and policy decisions.
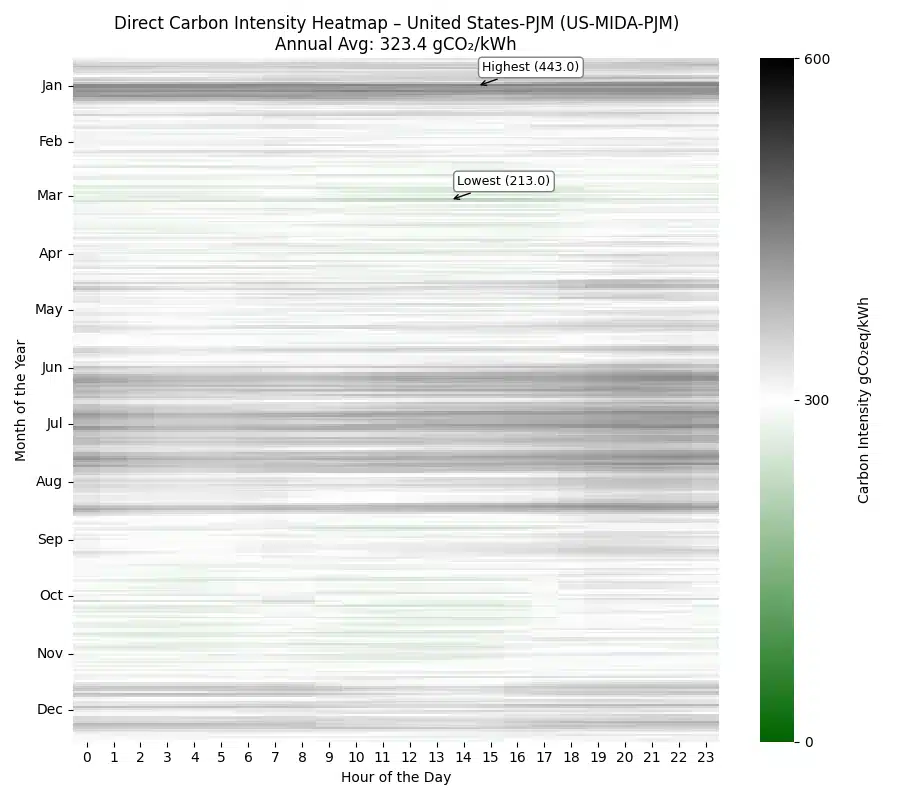
- Region Characteristics (United States): The PJM grid in the United States is less carbon-intensive; however, it still reflects a significant reliance on gas (as opposed to coal in China and India) throughout the year. The grid’s maximum carbon intensity is around 2.1 times greater than its minimum. The region has significant nuclear power production, which draws down the overall grid intensity, but a lack of renewables means gas remains the most significant source of power in most hours.
- Decarbonization Priorities: Prioritize renewable additions and regional transmission to drive cleaner electricity consumption, both from internal renewable generation and from imports. Storage, clean peaking capacity, and other flexibility mechanisms will be more important in driving down emissions in the long run.
Story 3 – Variable Renewable Energy Taking Over: United Kingdom & California
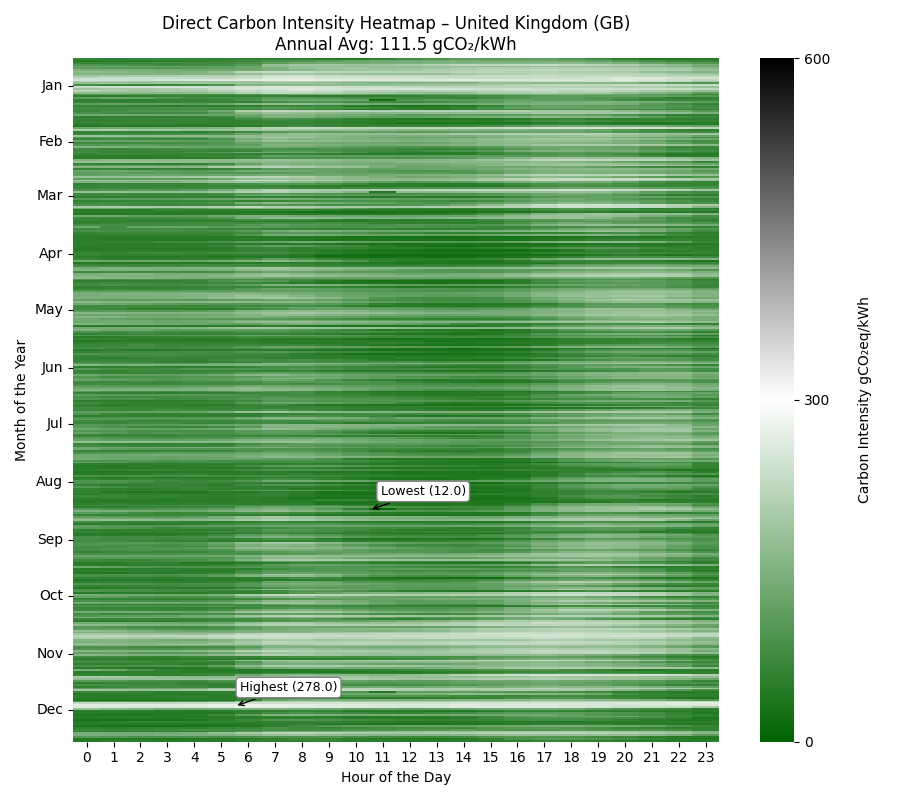
- Region Characteristics: The United Kingdom shows notable hourly variability in carbon intensity, with maximum carbon intensity 23 times higher than minimum. The significant role played by wind power is demonstrated, with very clean electricity in many hours of the year, particularly in certain winter weeks. Solar penetration is growing, and this shows during summer. However, the role of gas is also noticeable at times when wind and solar output are low. The grid’s average is considerably lower than other grids analyzed above.
- Decarbonization Priorities: Alongside continued renewable energy additions, regions in this category can greatly benefit from demand shifting toward cleaner hours, more short and long-duration energy storage, clean-dispatchable generation, and the development of time-based procurement structures like hourly-matched PPAs to drive the procurement of clean power around the clock.
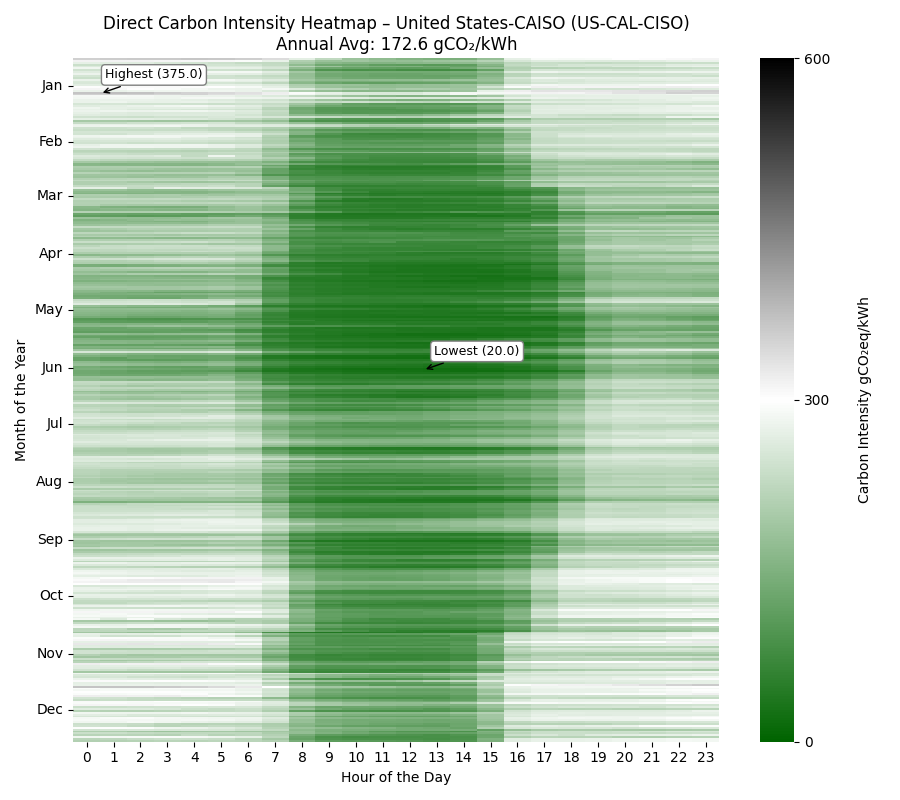
- Region Characteristics: California’s grid shows large intra-day variation in carbon intensity. The maximum carbon intensity is almost 19x higher than the minimum. California’s grid shows strong solar-driven dips in carbon intensity during midday, and sharp evening fossil ramp-up. This indicates that there is still insufficient evening clean flexibility.
- Decarbonization Priorities: Grids in this category will strongly benefit from load shifting and short and long-duration energy storage to maximise the benefits of solar generation. Shifting demand to daylight hours yields real emissions savings. Additional storage and policy support for 24/7 carbon-free electricity strategies are key next steps.
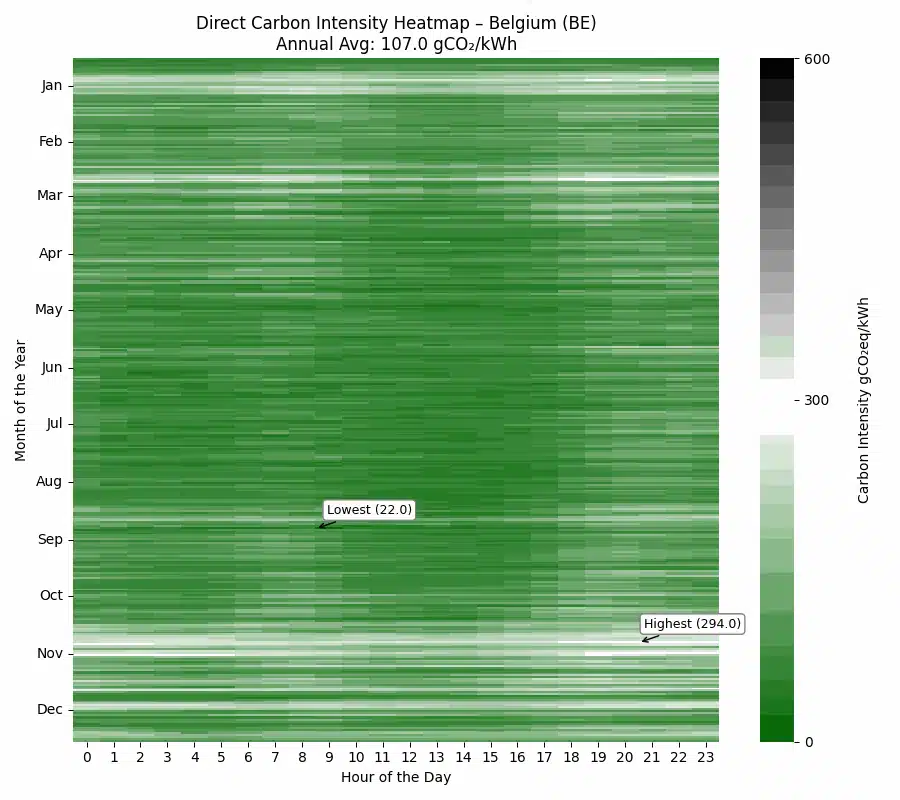
Story 4 – End-Game, Clean Power 24/7: Norway
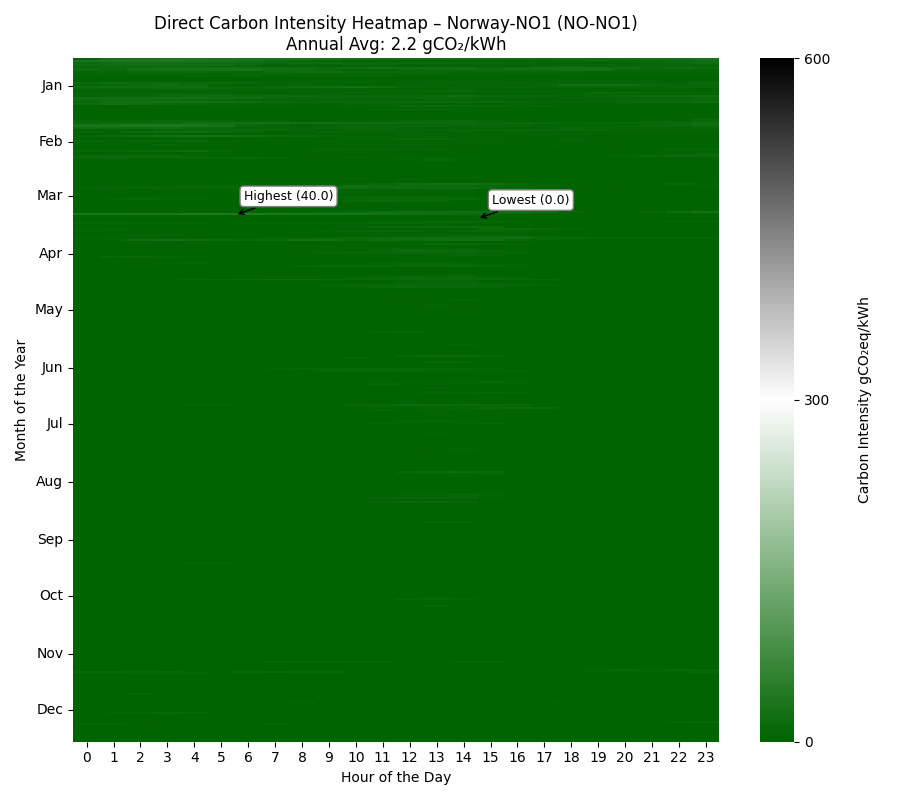
- Region Characteristics (Norway): Norway’s NO1 grid has near-zero carbon intensity 24/7, this is thanks to abundant hydropower and relatively small demand. The maximum carbon intensity is only 40 gCO₂/kWh, and the minimum goes all the way to 0 gCO₂/kWh. The average carbon intensity in 2024 was just 2.2 gCO₂/kWh — one of the cleanest grids globally.
- Decarbonization Priorities: Maintain carbon-free reliability despite load growth while exploring how to share surplus clean power through exports.
Conclusion – Time Matters
Annual averages hide the real story, relying solely on yearly carbon intensity masks the hours when emissions are highest, and leaves us blink to the crucial need for flexibility solutions. This analysis shows that hourly carbon intensity can vary by more than 1000 gCO₂/kWh across the year, even within the same grid, and this effect becomes even more prevalent as renewables continue to dominate global electricity generation additions.
To drive meaningful decarbonization, we need to use this data. Hourly carbon intensity is essential for accurate emissions reporting, credible Scope 2 claims, and smart procurement and operational decisions. Acting on this means shifting demand to low-carbon hours, investing in flexible technologies like storage and demand response, and updating carbon accounting standards to reflect real-time emissions, not annual approximations that will become more inaccurate over time.
As we move toward a carbon-free future, dominated by renewables, when we consume and buy electricity is everything. Hourly data is freely available now, so it’s time to use it to ensure we are tracking emissions accurately for the renewables age.
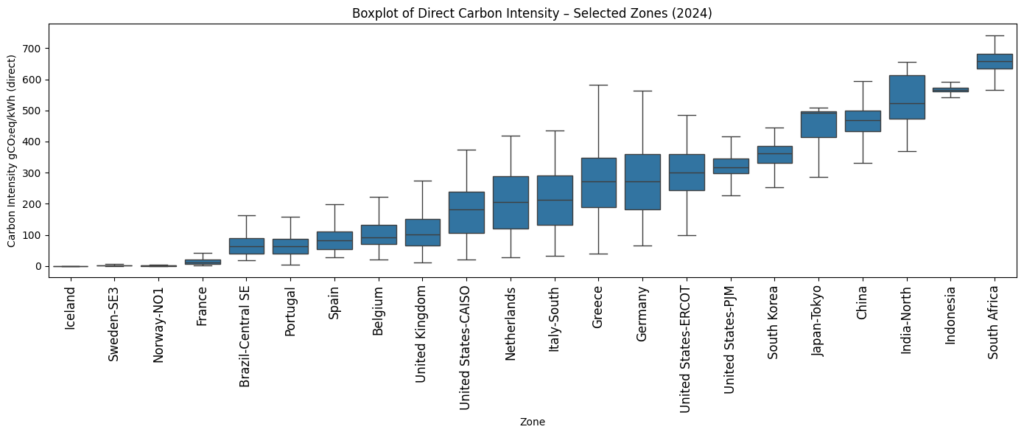
Annex 1 – Overview of Regional Carbon Intensity Performance
The box plots (showing the mean, interquartile range, and min/max values) below give a comparative overview of the carbon intensity for certain key zones. We see clearly, the renewable heavy regions like Germany, ERCOT, or CAISO have large variance, making hourly accounting all the more important.
Annex 2 – Summary Visualization
- This GIF image displays the 2024 hourly carbon intensity heatmaps for the zones analyzed in the box plot above.