Understanding Power Grids Through Hourly Analysis

Numerous countries have established climate goals and are actively working towards decarbonizing their electricity grids. The transition to clean power grids involves the increasing integration of variable renewable energy sources. Some countries have substantially penetrated variable renewable energy, while others are poised to reach significant milestones soon.
As variable renewable energy takes center stage with more installed capacity and generation, analyzing the availability of clean power on an hourly, not just an annual basis, is a must if we are to make the smartest choices in getting to zero-carbon grids with increasing focus on decarbonizing the low renewable hours.
Leveraging hourly data on electricity production from ElectricityMaps, we analyzed countries with varying degrees of renewable penetration, ranging from high to low. The aim of performing this analysis was to visualize clean and fossil-powered penetration on a real-time basis. Here are three key conclusions from our study.
1. For a True Picture of Grid Decarbonization, Hourly Analysis is Critical
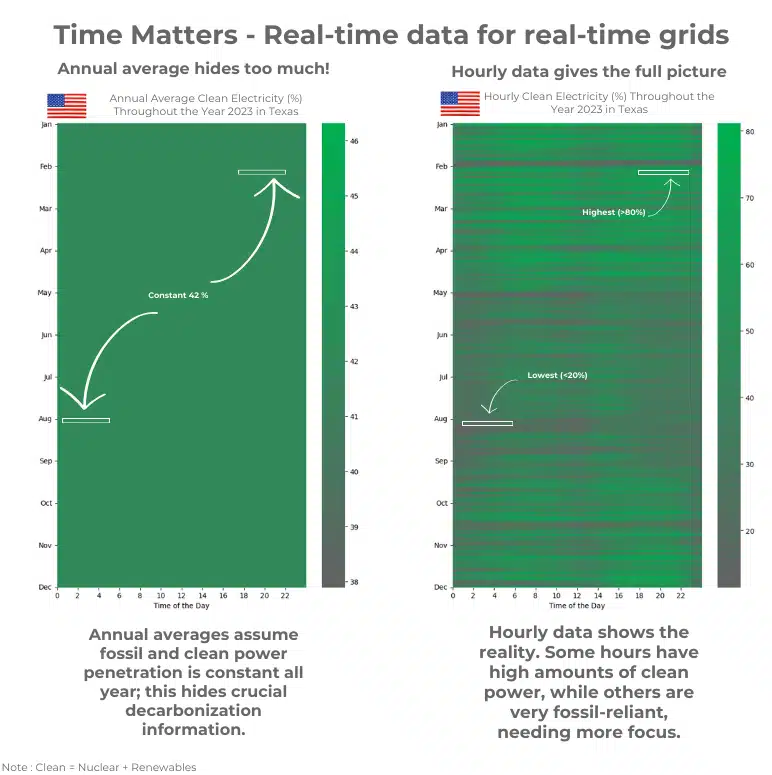
Figure 1: Electricity production comparison – Annual Average vs Hourly.
Data Source: ElectricityMaps.
Analyzing the grid on an hourly basis gives a clear view of when fossil fuels dominate and when renewable energy is abundant. This approach shows the real situation of the power grid. Yearly averages fail to capture the inherent variability of some sources of renewable power generation, hiding the hours when fossil fuels are dominant and where the most focus is needed on new technologies that tackle these hard hours.
Figure 1 represents the ERCOT grid in Texas, USA. On an annual average, 42% of energy comes from renewables; that’s not bad! But it’s not the full picture. When we look at the hourly numbers, we see many hours when fossil penetration remains dominant. In fact, for more than two-thirds of the year, fossil generation is higher than renewable generation. This highlights the need to examine specific hours to understand and address the challenges of relying too much on non-renewable sources.
2. Hourly Analysis Shows Us Where to Focus our Efforts
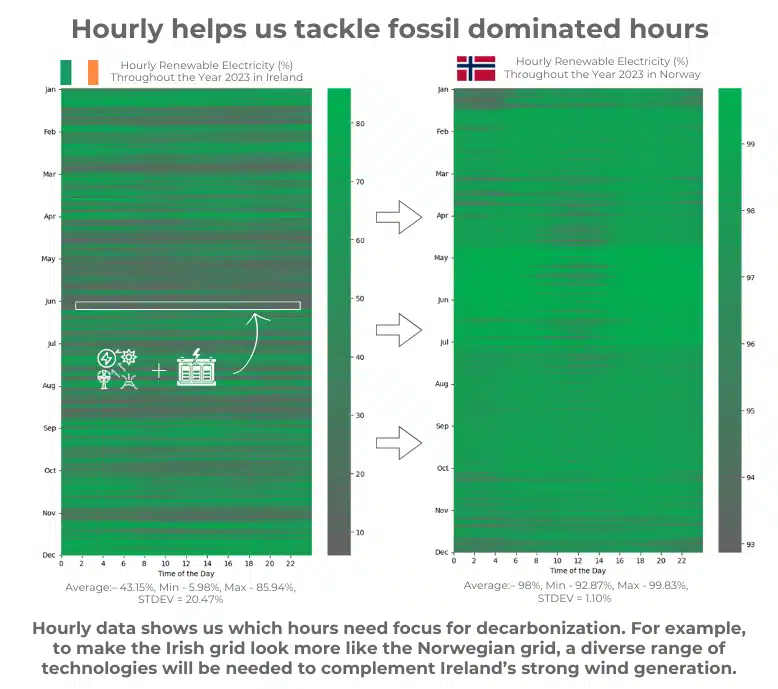
Figure 2: Every hour electricity production comparison in Ireland and Norway.
Data Source: ElectricityMaps.
To shift entirely to dependable and clean energy year-round, substantial investments in advanced storage and flexibility technologies, grids, and renewables are essential. Hourly analysis shows us that some hours will require more focus than others.
For example, Figure 2 highlights Ireland’s current renewable penetration on an hourly basis. Annually, Ireland has one of the highest rates of renewable penetration in the world; that’s great! When it’s windy, renewable penetration can reach over 85%. But when it’s not, fossil fuels dominate, as Ireland has low solar and hydro resources and relatively little interconnection. This highlights the many hours when new technologies are needed to tackle fossil reliance, in particular short and long-duration energy storage. Hourly analysis like this shows us the job that must be done to make Ireland look more like Norway – powered by renewables on a 24/7 basis.
3. Hourly Analysis Shows Us that Every Country is Unique
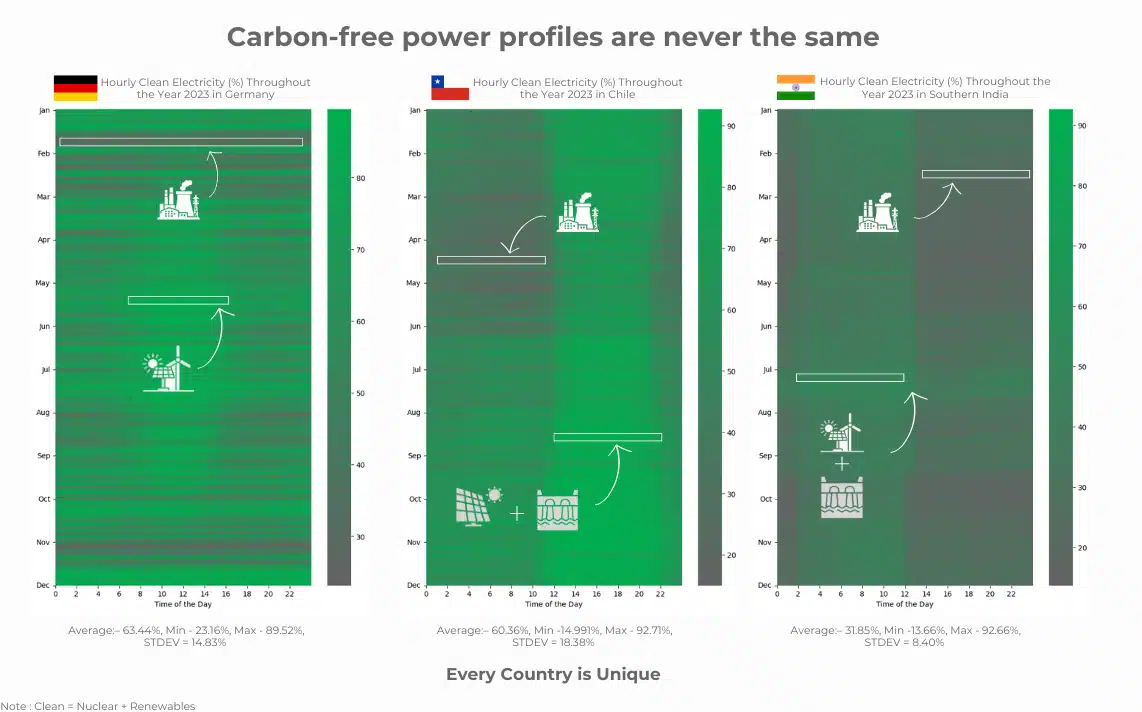
Figure 3: Electricity production every hour in Germany, Chile, and Southern India.
Data Source: ElectricityMaps.
Each country presents a unique set of challenges in managing variable renewables within its energy portfolio, necessitating a tailored strategy to address current and future issues. Consider three countries shown in Figure 3 to illustrate this point:
Germany: The energy landscape in Germany is diverse, featuring substantial amounts of solar and wind. This diversity contributes to significant fluctuations in energy production on an hourly basis, creating challenges in maintaining grid stability at all hours without fossil reliance.
Chile: As a typical tropical country, Chile relies heavily on solar and hydro energy. The abundance of solar resources results in considerable hourly variations throughout the year, posing challenges for energy grid management that storage could have a key role in resolving.
Southern India: Despite its reliance on coal, India incorporates a significant share of renewables, including hydro, wind, and solar. While coal dominates, the increasing capacity of wind and solar introduces smaller variations currently, with the potential for greater fluctuations as more renewable capacity is integrated into the grid. Again, storage can play a key role in driving out coal.
So What Does This Mean For Clean Power Procurement?
We hope this analysis has made it clear that dynamic hourly data is a must if we want to understand grid decarbonization. That’s why we must move from annual to hourly energy tracking when making green claims and procurement decisions. Granular Certificates are the tool we need to make this transition to clean energy markets and claims that enable us to make the informed choices needed to tackle grid decarbonization every hour, everywhere.